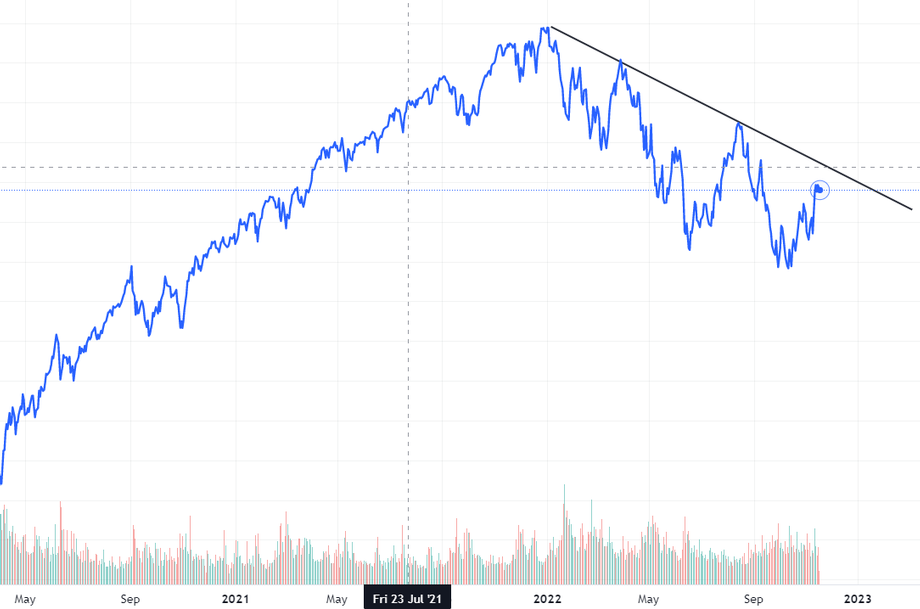
Hello Again – This is a chart of the S&P 500 stock index ever since May 2020. So it covers about 2 ½ years or so. You can see the big rally after the covid shutdowns when the Fed pumped all the money into the system. Then you can see the downtrend that started at the beginning of this year as the Fed started to pull back on the support it provided, and even drain money out of the system. That’s still happening as of now. Hence the down trend is still intact, and the charts clearly show this. The S&P 500 index is still trading below that black line. The trend will remain down until that trendline is violated. If and when it starts trading above that line and stays there, then that would be a good sign that maybe the trend has changed from down to up.
A few years ago I developed a dual set of indicators for gauging market conditions. Its not perfect, but it works well enough to share. One is based on forward economic indicators and the other is based on the price of the S&P 500 stock index we see below. Combined, the indicators are either Green, Yellow, or Red. Right now the combined indictor is still Red, and it has been Red since about the first week of March. It briefly turned Yellow in August, but soon thereafter went right back to Red.
I haven’t used this to get in and out of the market much, because I don’t trade. But it is a tool that can help us realize trend changes at times. For instance, if nearing retirement and growing more cautious, then maybe a new Red signal is something to pay attention to and might encourage us to reduce risk. Or, if we have new money to invest, or we are trying to find a way to get more aggressive, then a new Green signal might help us with that decision as well, by suggesting it’s time to get that money invested. It’s something I may be sharing with you in the future when the signal changes, but as for right now, the chart below is in a down trend, and the indicators are still Red. Stay tuned, things can change fast!
Wishing you all a peaceful and joyous Thanksgiving Holiday,
Mike
S&P 500 Still In Downtrend Mode – (The S&P 500 is a widely followed stock index consisting of some 500 of the biggest publicly traded companies in America)